
Publishing recurring stakeholder reports without losing control

How we built a proof of concept that updates business reports, checks every change, and keeps people accountable for what gets published through an AI model.
Most organisations produce the same reports again and again: monthly performance packs, quarterly updates, annual summaries. The structure barely changes, but the numbers do, and every update means hunting through the document for each place a figure appears.
That is harder than it sounds. A single revenue figure can appear in the executive summary, a commentary paragraph, a performance table, a KPI callout and a chart. Miss one, and the report contradicts itself. Simple find-and-replace does not help either, because the same number can mean something different in another section, period or calculation.
The structure of a recurring report barely changes. The numbers do, and so does the risk of missing one.
At AYLA Solutions, we built a working proof of concept to explore a better way. It is aimed at finance and operations teams, consultants preparing board and client packs, and anyone who produces the same monthly, quarterly or annual report each cycle.
The goal is simple: less time on repetitive edits, fewer inconsistencies across a report, and a clear record of every change for reviewers and auditors.
How it works
A user uploads an existing report and enters approved business updates in plain English, for example: “Revenue for 2024 increased from $80 million to $90 million.”
The system then:
• Finds every relevant occurrence across text, tables, charts and supported images.
• Checks each match against the metric, the previous value, the reporting period and the surrounding context before changing anything.
• Updates what it can verify, including supported totals and percentage changes.
• Is designed to leave uncertain items unchanged and list them for human review.
• Produces an audit trail: the updated report, a plain-English change summary and, for Word reports, a tracked-changes version.

A performance table before and after an update. Current-year figures change; the prior-year comparison column is left untouched.
Charts and visuals stay in step
Reports are more than text. The same verified values flow through to native charts and supported images, so a chart never shows last month’s number next to this month’s commentary. The original layout, styling and page structure are preserved.

The report’s chart is updated from the same verified values, with no manual chart editing.
Where AI fits, and where it doesn’t
AI is used for one narrow job: helping write clear wording once a change has been verified. The numbers, the matching decisions and the calculations are handled by rules, not by the language model. If generated wording fails validation, the system uses a safe fallback or flags the item for review.
Our design principle AI can make reporting faster, but the facts must come from trusted data, and people stay accountable for what is published. |
Every change is visible
Reviewers do not have to take the system’s word for it. Every run, whatever the report format, produces a plain-English change summary showing what was updated and what was left for review, plus a detailed audit record for anyone who needs to trace a change. Word reports also come back with tracked changes, so each edit can be checked before it is accepted.
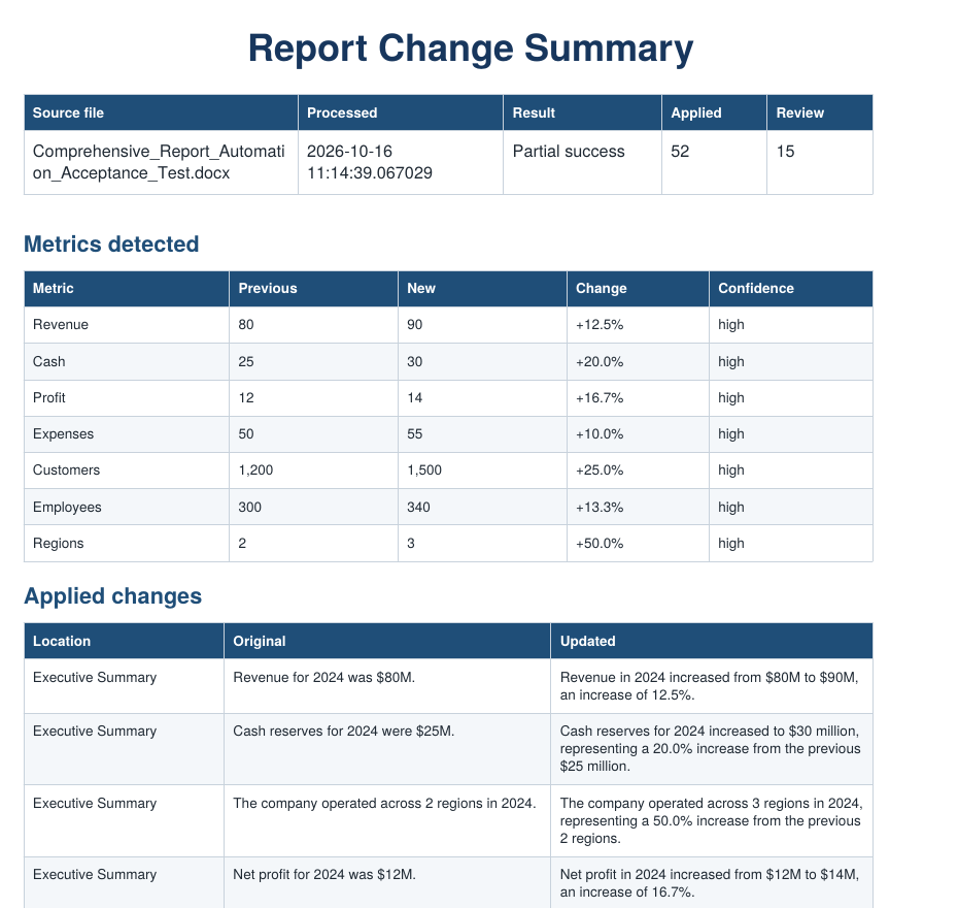
The plain-English change summary produced for every report format, listing each metric, the previous and new values, and every change made.

For Word reports, tracked changes show exactly what was updated, while the surrounding commentary is kept.
What we have tested
The proof of concept supports Word, PowerPoint and searchable PDF reports. It has been tested on reports ranging from short synthetic documents to a published annual report of more than 200 pages, with verified updates applied across tables, charts and commentary, and uncertain items set aside for review. Processing time depends on the length and complexity of the report.
What comes next
This is a working proof of concept, not a finished product. Taking it further would mean tailoring it to an organisation’s own metrics and terminology, testing it with their real reports, and adding the security and deployment controls a production system needs.


Comments